

Check out these quick stats from the past month in the Hampton Roads Real Estate Market.
All statistics from REIN including attached & detached residential homes in southside, Williamsburg, and the peninsula.
New Listings
3,525 New Listings hit the market in August! While this is a 12.2% decrease from new listings in July, it is up 9.7% compared to August of last year. The amount of new listings has helped active inventory increase 1.1% averaging at 1.3 Months of Inventory.
Sold Homes
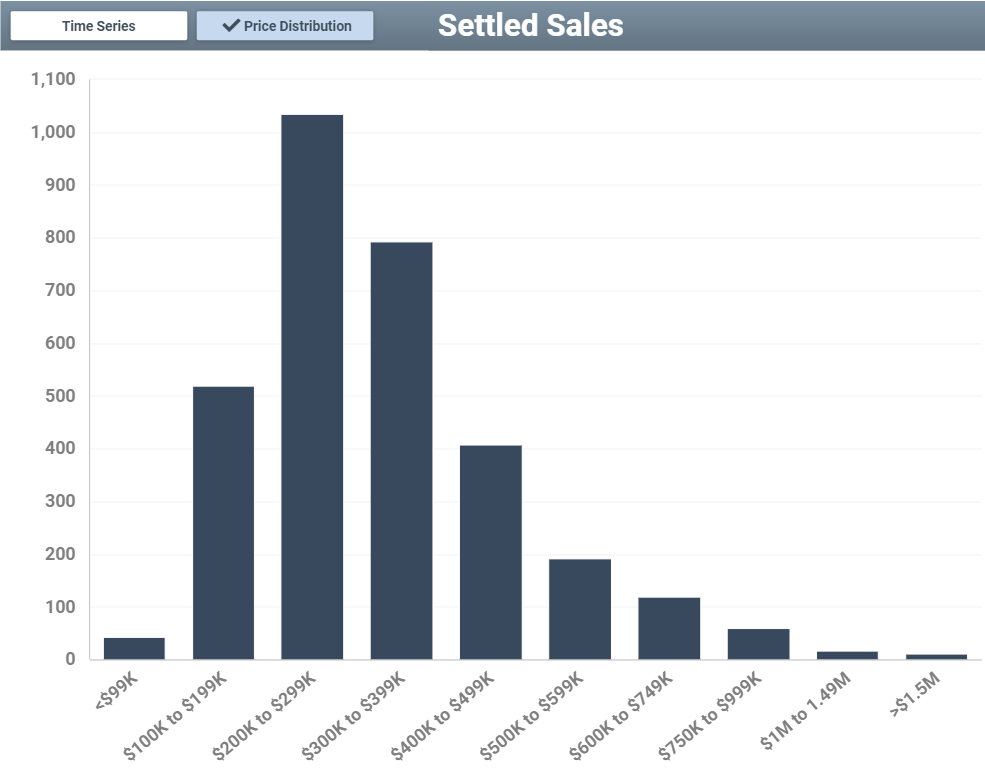
3,193 Homes were Sold in August! Similar to listings, this number is a decrease of 7.1% compared in sales in July but a 6.2% increase compared to August of last year. Check out the below chart for the price distribution for those 3,000+ settled sales. The majority, at 1,035 homes were between the $200,000-$299,000 range followed by 792 homes in the $300,000-$399,000 category. There were a total of 27 homes sold for over $1 million!
Active Buyers
With 2,835 active buyers across Hampton Roads, we aren’t surprised to see the market maintain it’s Seller’s Market status. There is plenty of demand out there for the new listings as soon as they hit the market! From these active buyers there were over 50,000 interactions!
Days on the Market
Speaking of, the median Days on Market continues to stay steady at just 11 days. From “For Sale” to “Under Contract”, buyer’s are putting in offers and getting accepted just 11 days after listings go live.
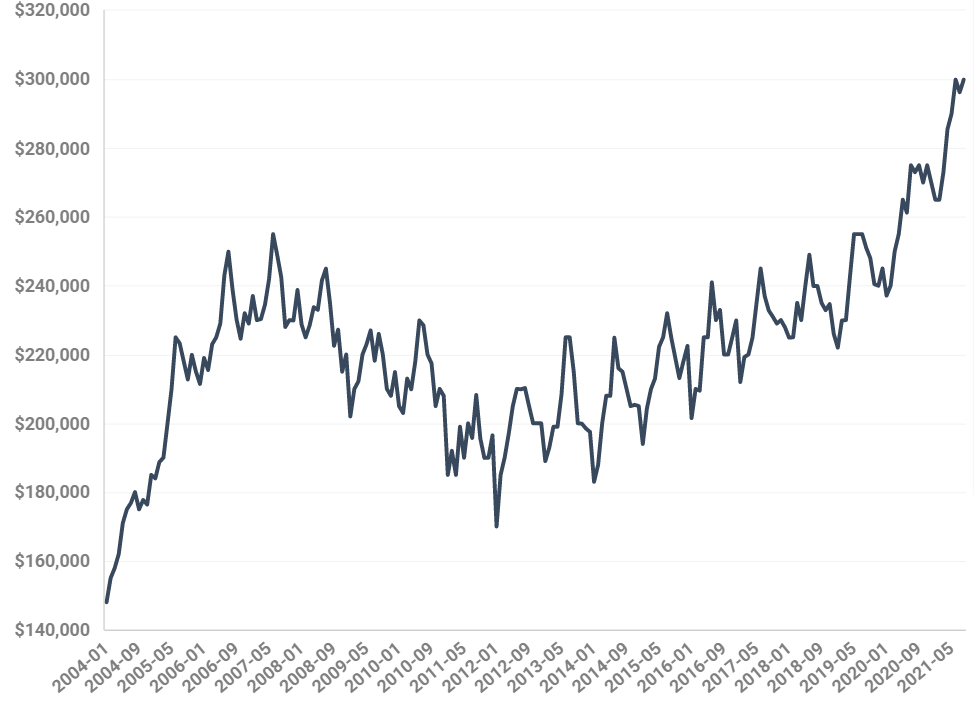
Sales Price
With the continued high demand and lower inventory, sales prices continue to rise to record highs. Averaging at $299,900 for the month of August, the below chart shows where these current prices stack up compared to the past decade and beyond!
If you’re ready to get into the mix of this market, contact Eric or Danielle to get started! We’d love to catch up and share how these statistics impact your home’s value.


Pingback:เว็บคาสิโนออนไลน์
Pingback:Buy Vape carts online
Pingback:albino penis envies
Pingback:Dnabet.com
Pingback:SIAM855
Pingback:웹툰 사이트
Pingback:สั่งดอกไม้ออนไลน์
Pingback:เปิดบัญชี exness
Pingback:ทรัสเบท
Pingback:recurve bow
Pingback:คาเฟ่ ชลบุรี
Pingback:สีทนไฟ
Pingback:sahabat qq
Pingback:รับทำเว็บ